Features
Fund Insights Features
Access comprehensive fund data, interactive visualizations, and risk analysis to enhance your investment strategy. All metrics are updated monthly based on month-end, total return data.

Comparison Pages
View a complete list of all funds within the fund family, with sortable columns for total return and risk metrics, making it easy to compare performance and assess investment suitability.
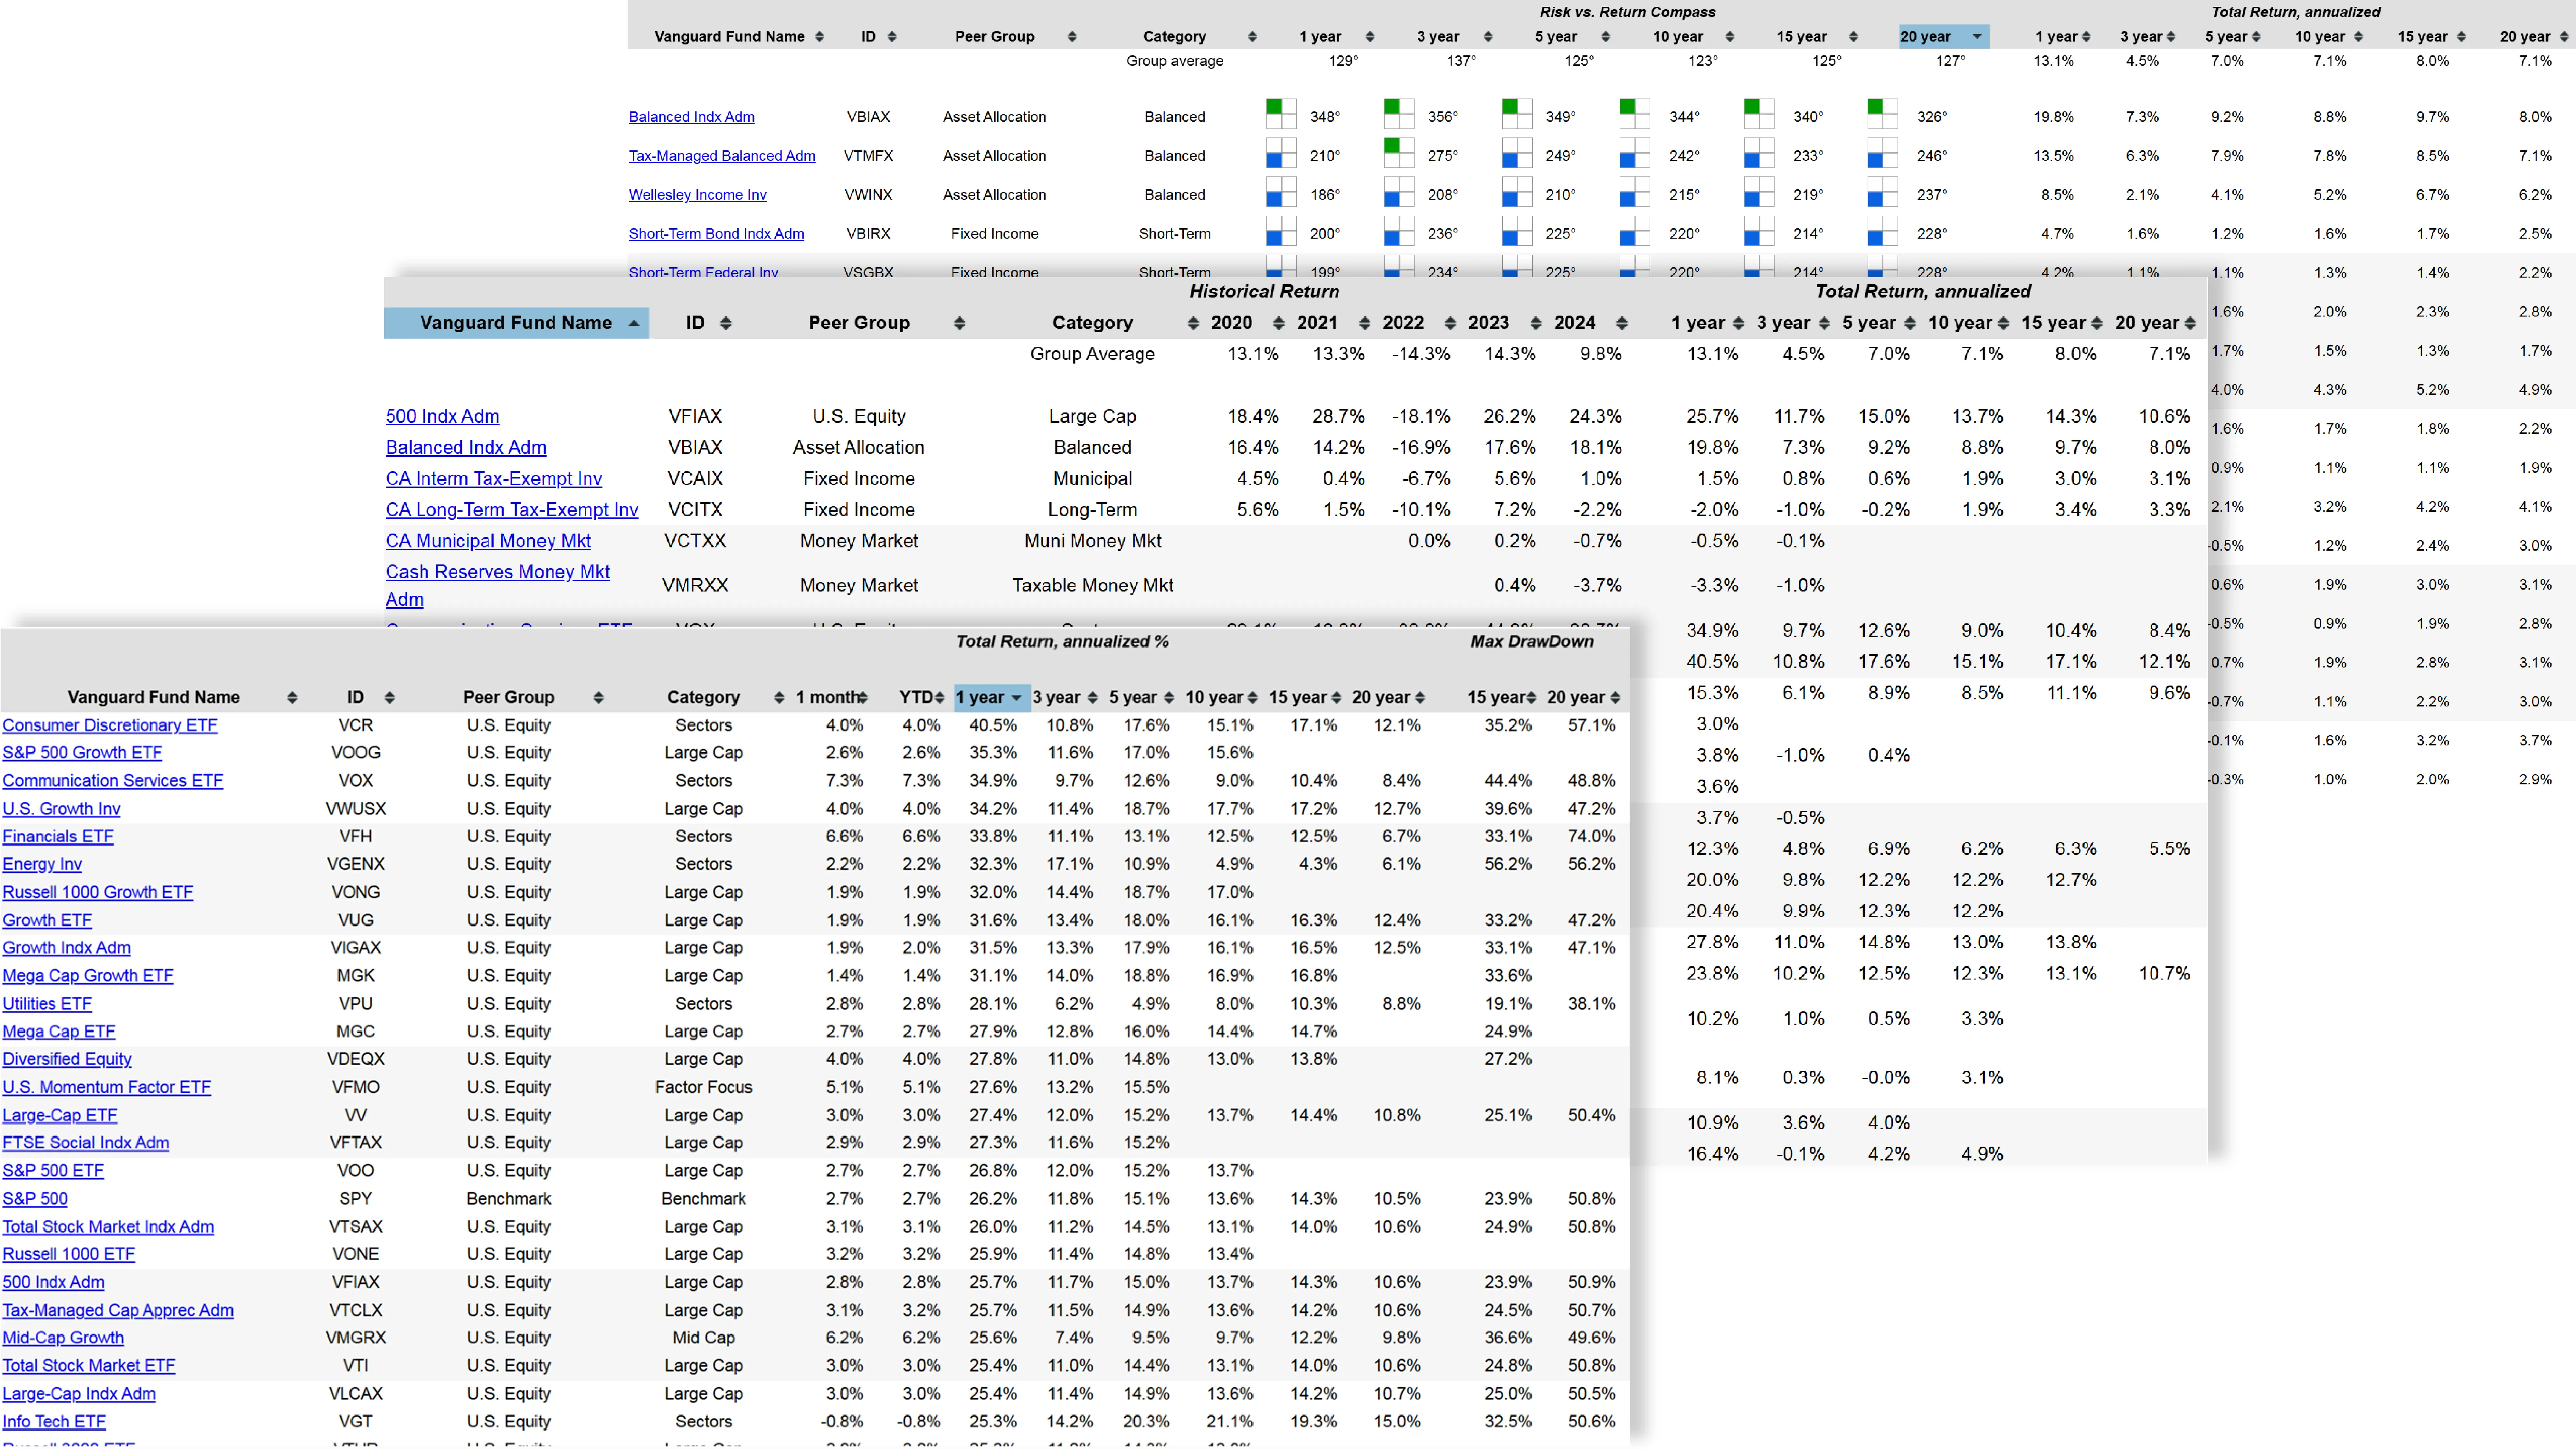

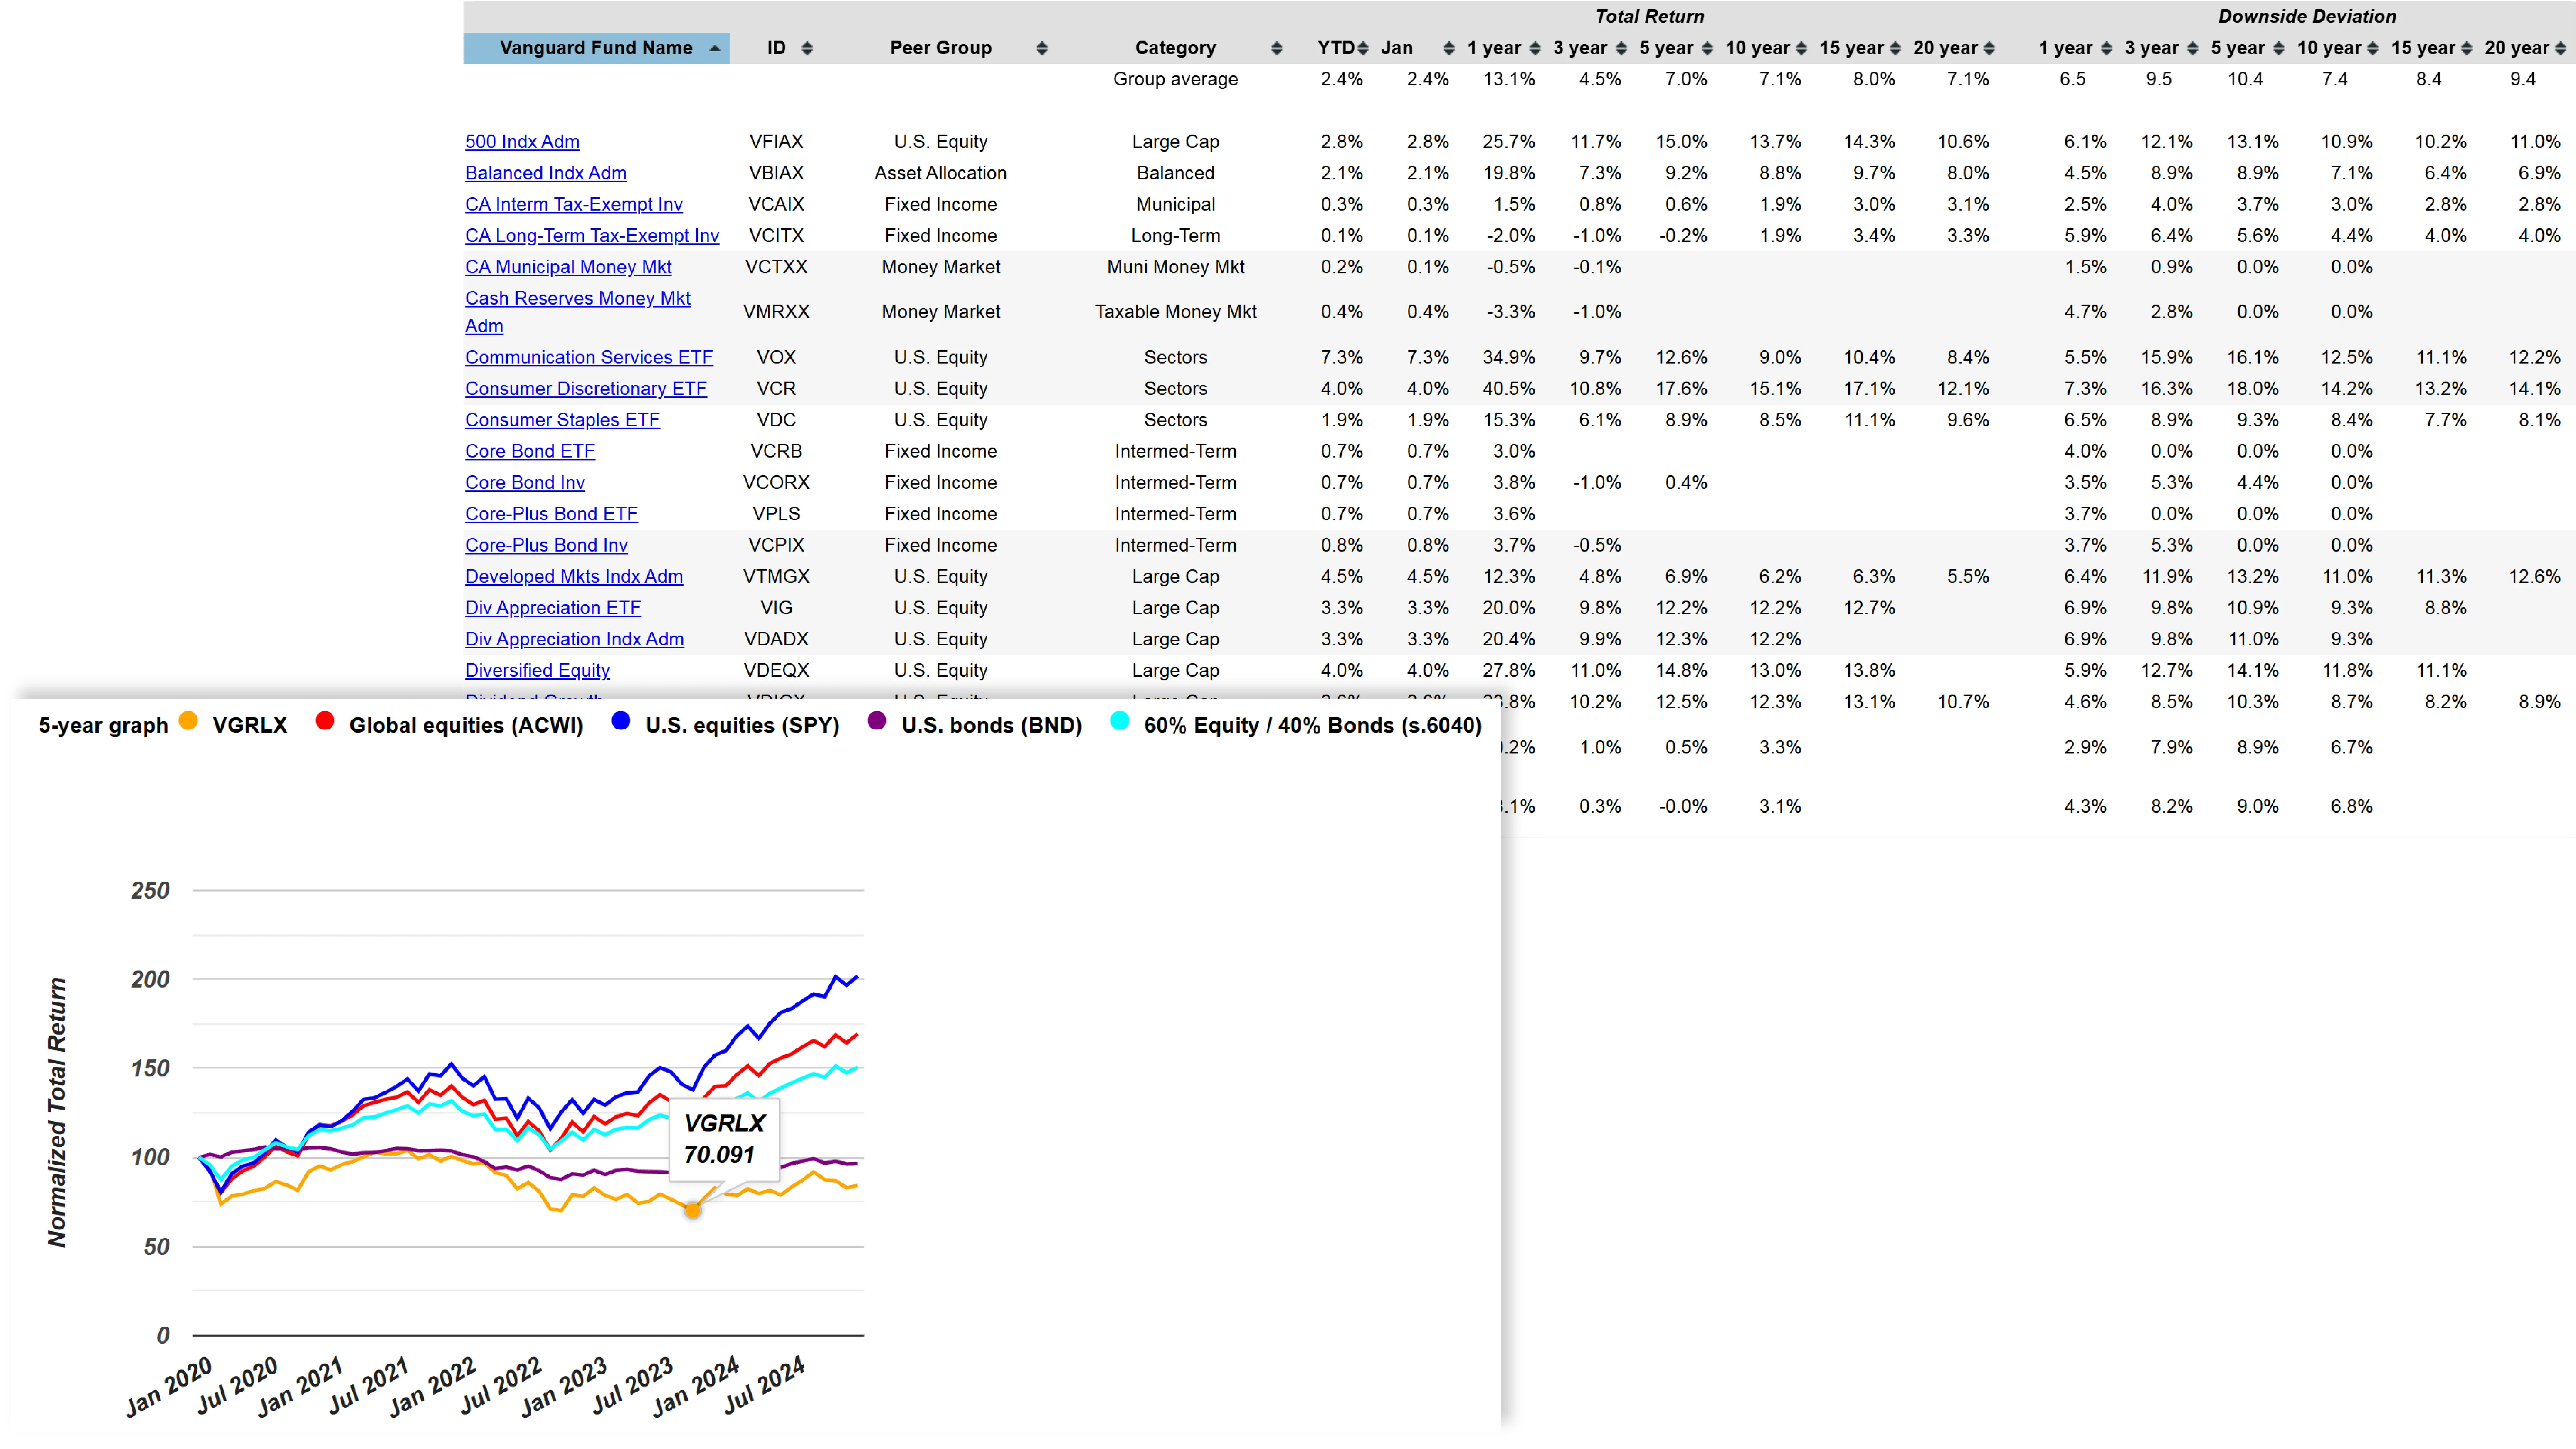
Total Return
Shows the average annualized return over 1, 3, 5, 10, 15, and 20 years, providing a clear view of long-term performance and investment growth trends.
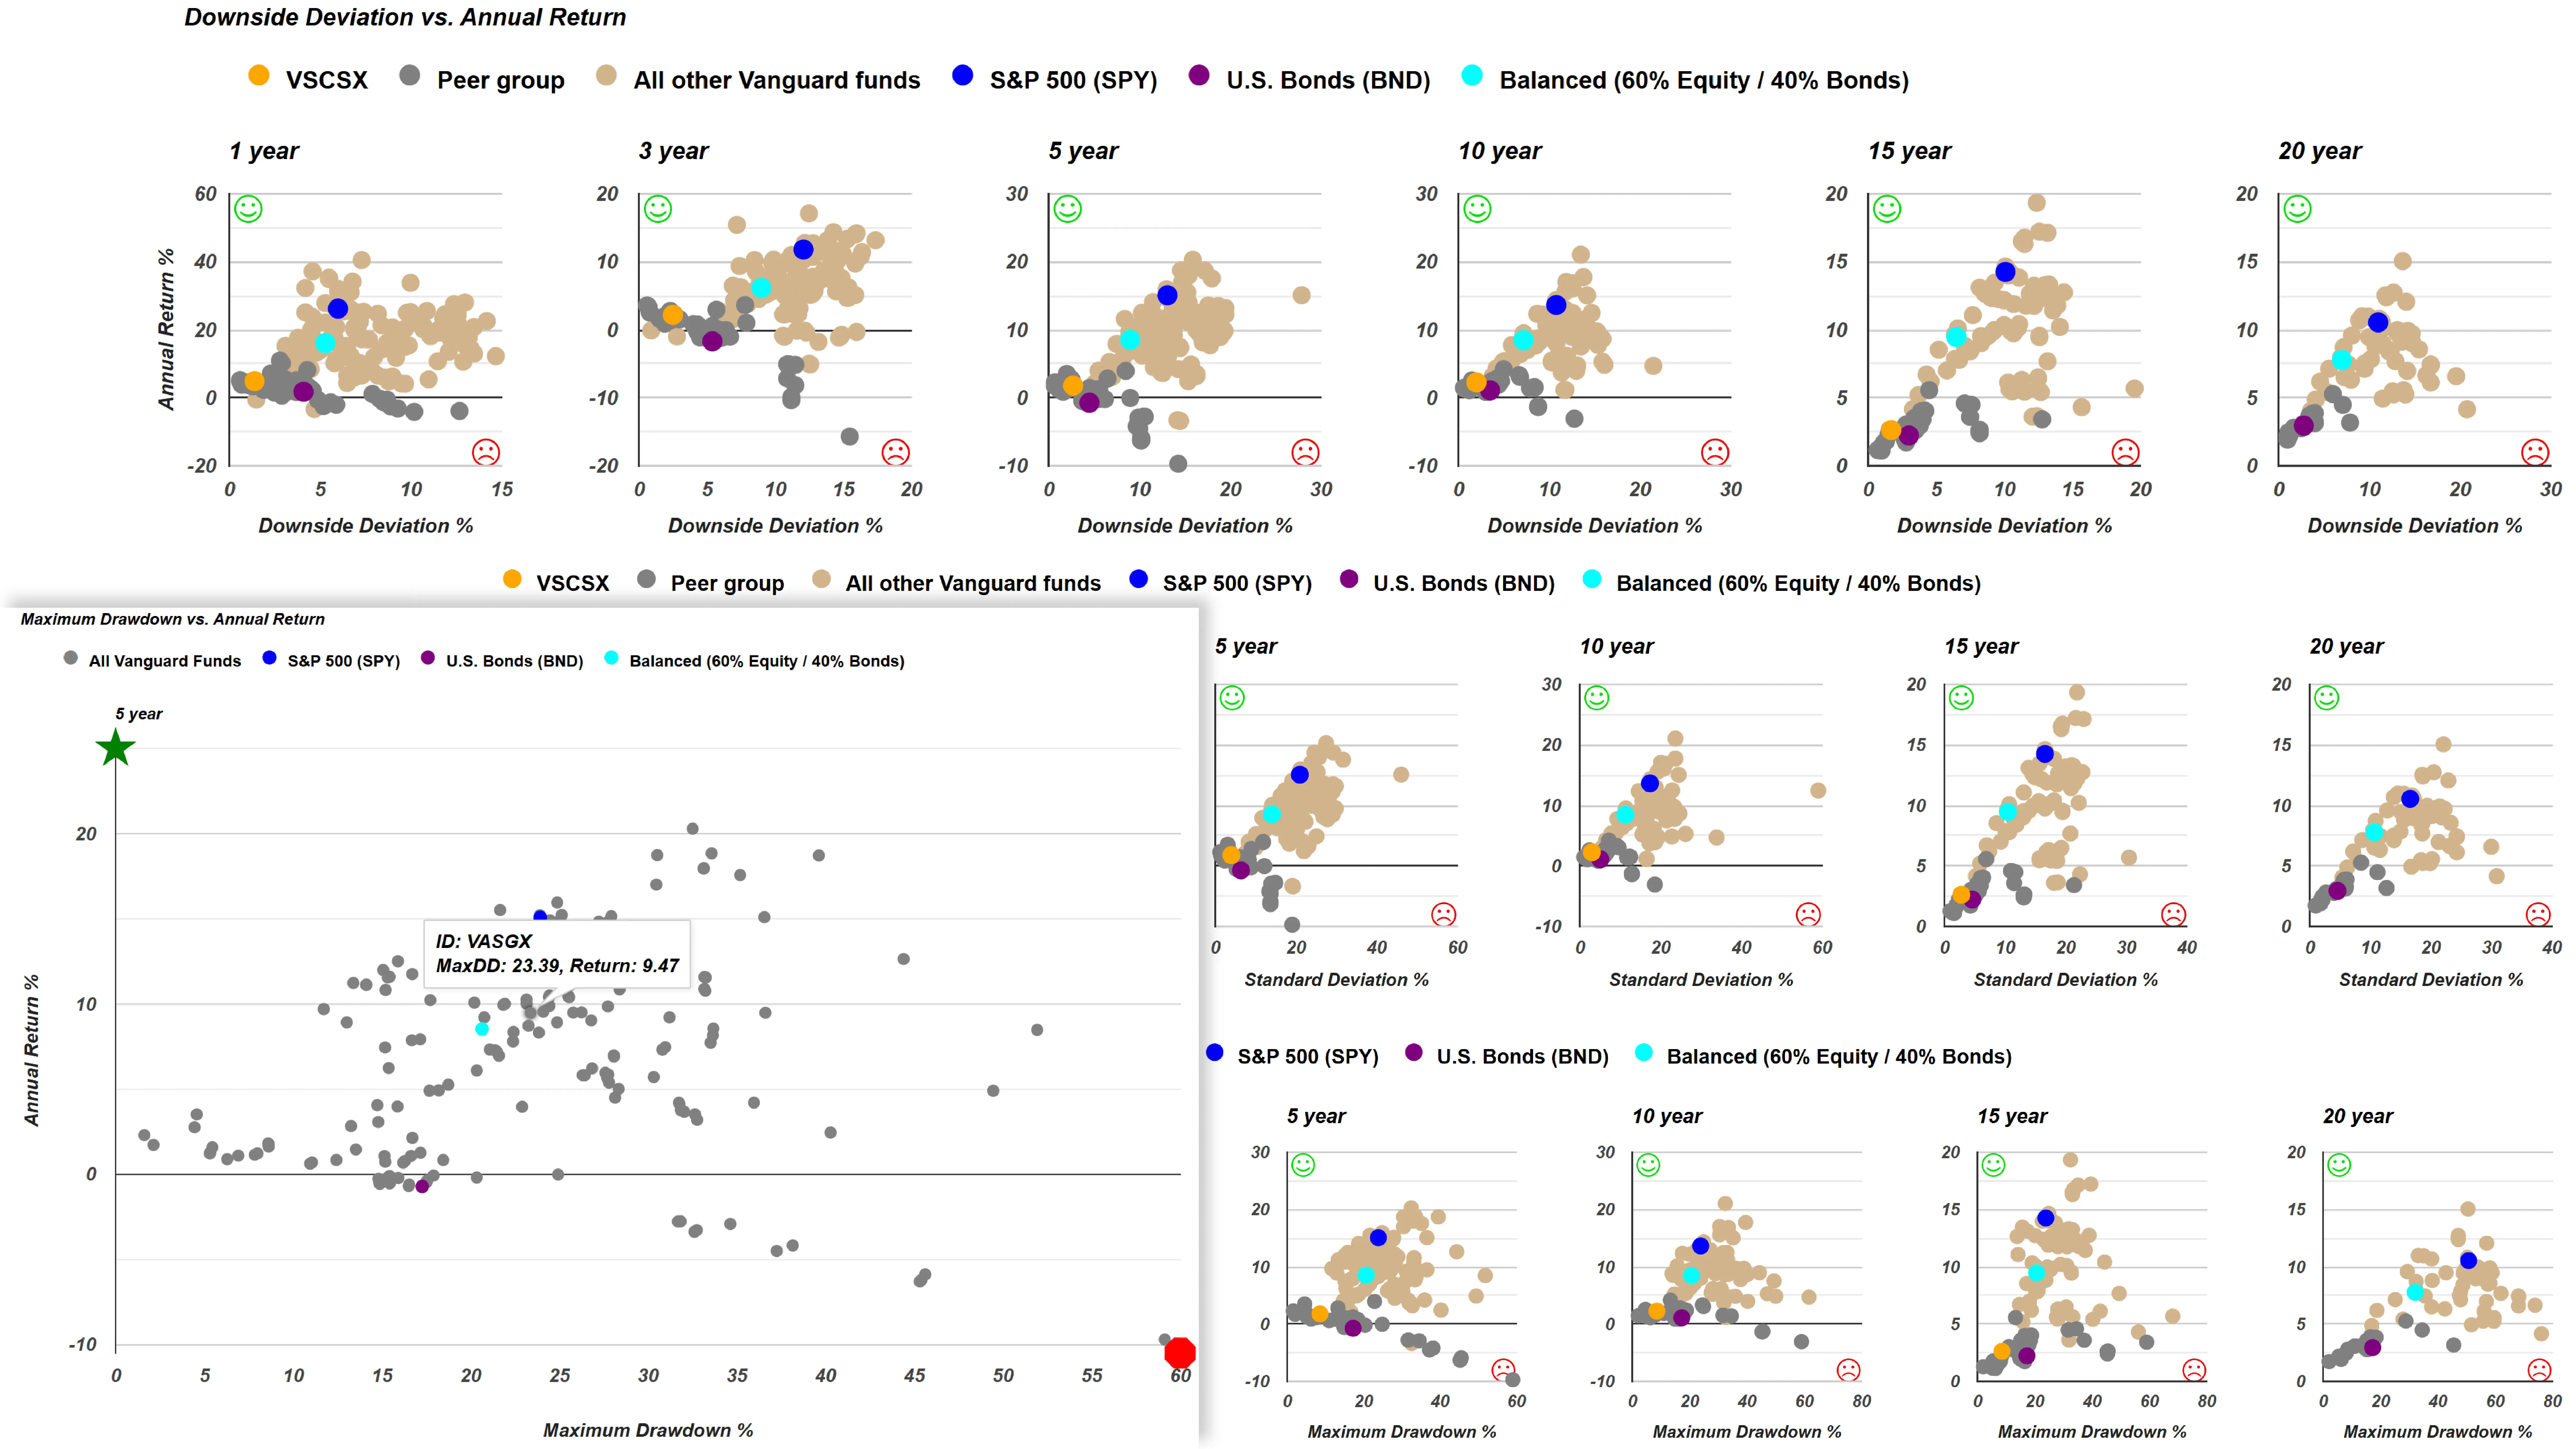
Risk vs. Return Scatterplots
Compares total return against key risk metrics, including maximum drawdown, downside deviation, and standard deviation, to help evaluate risk-adjusted performance.

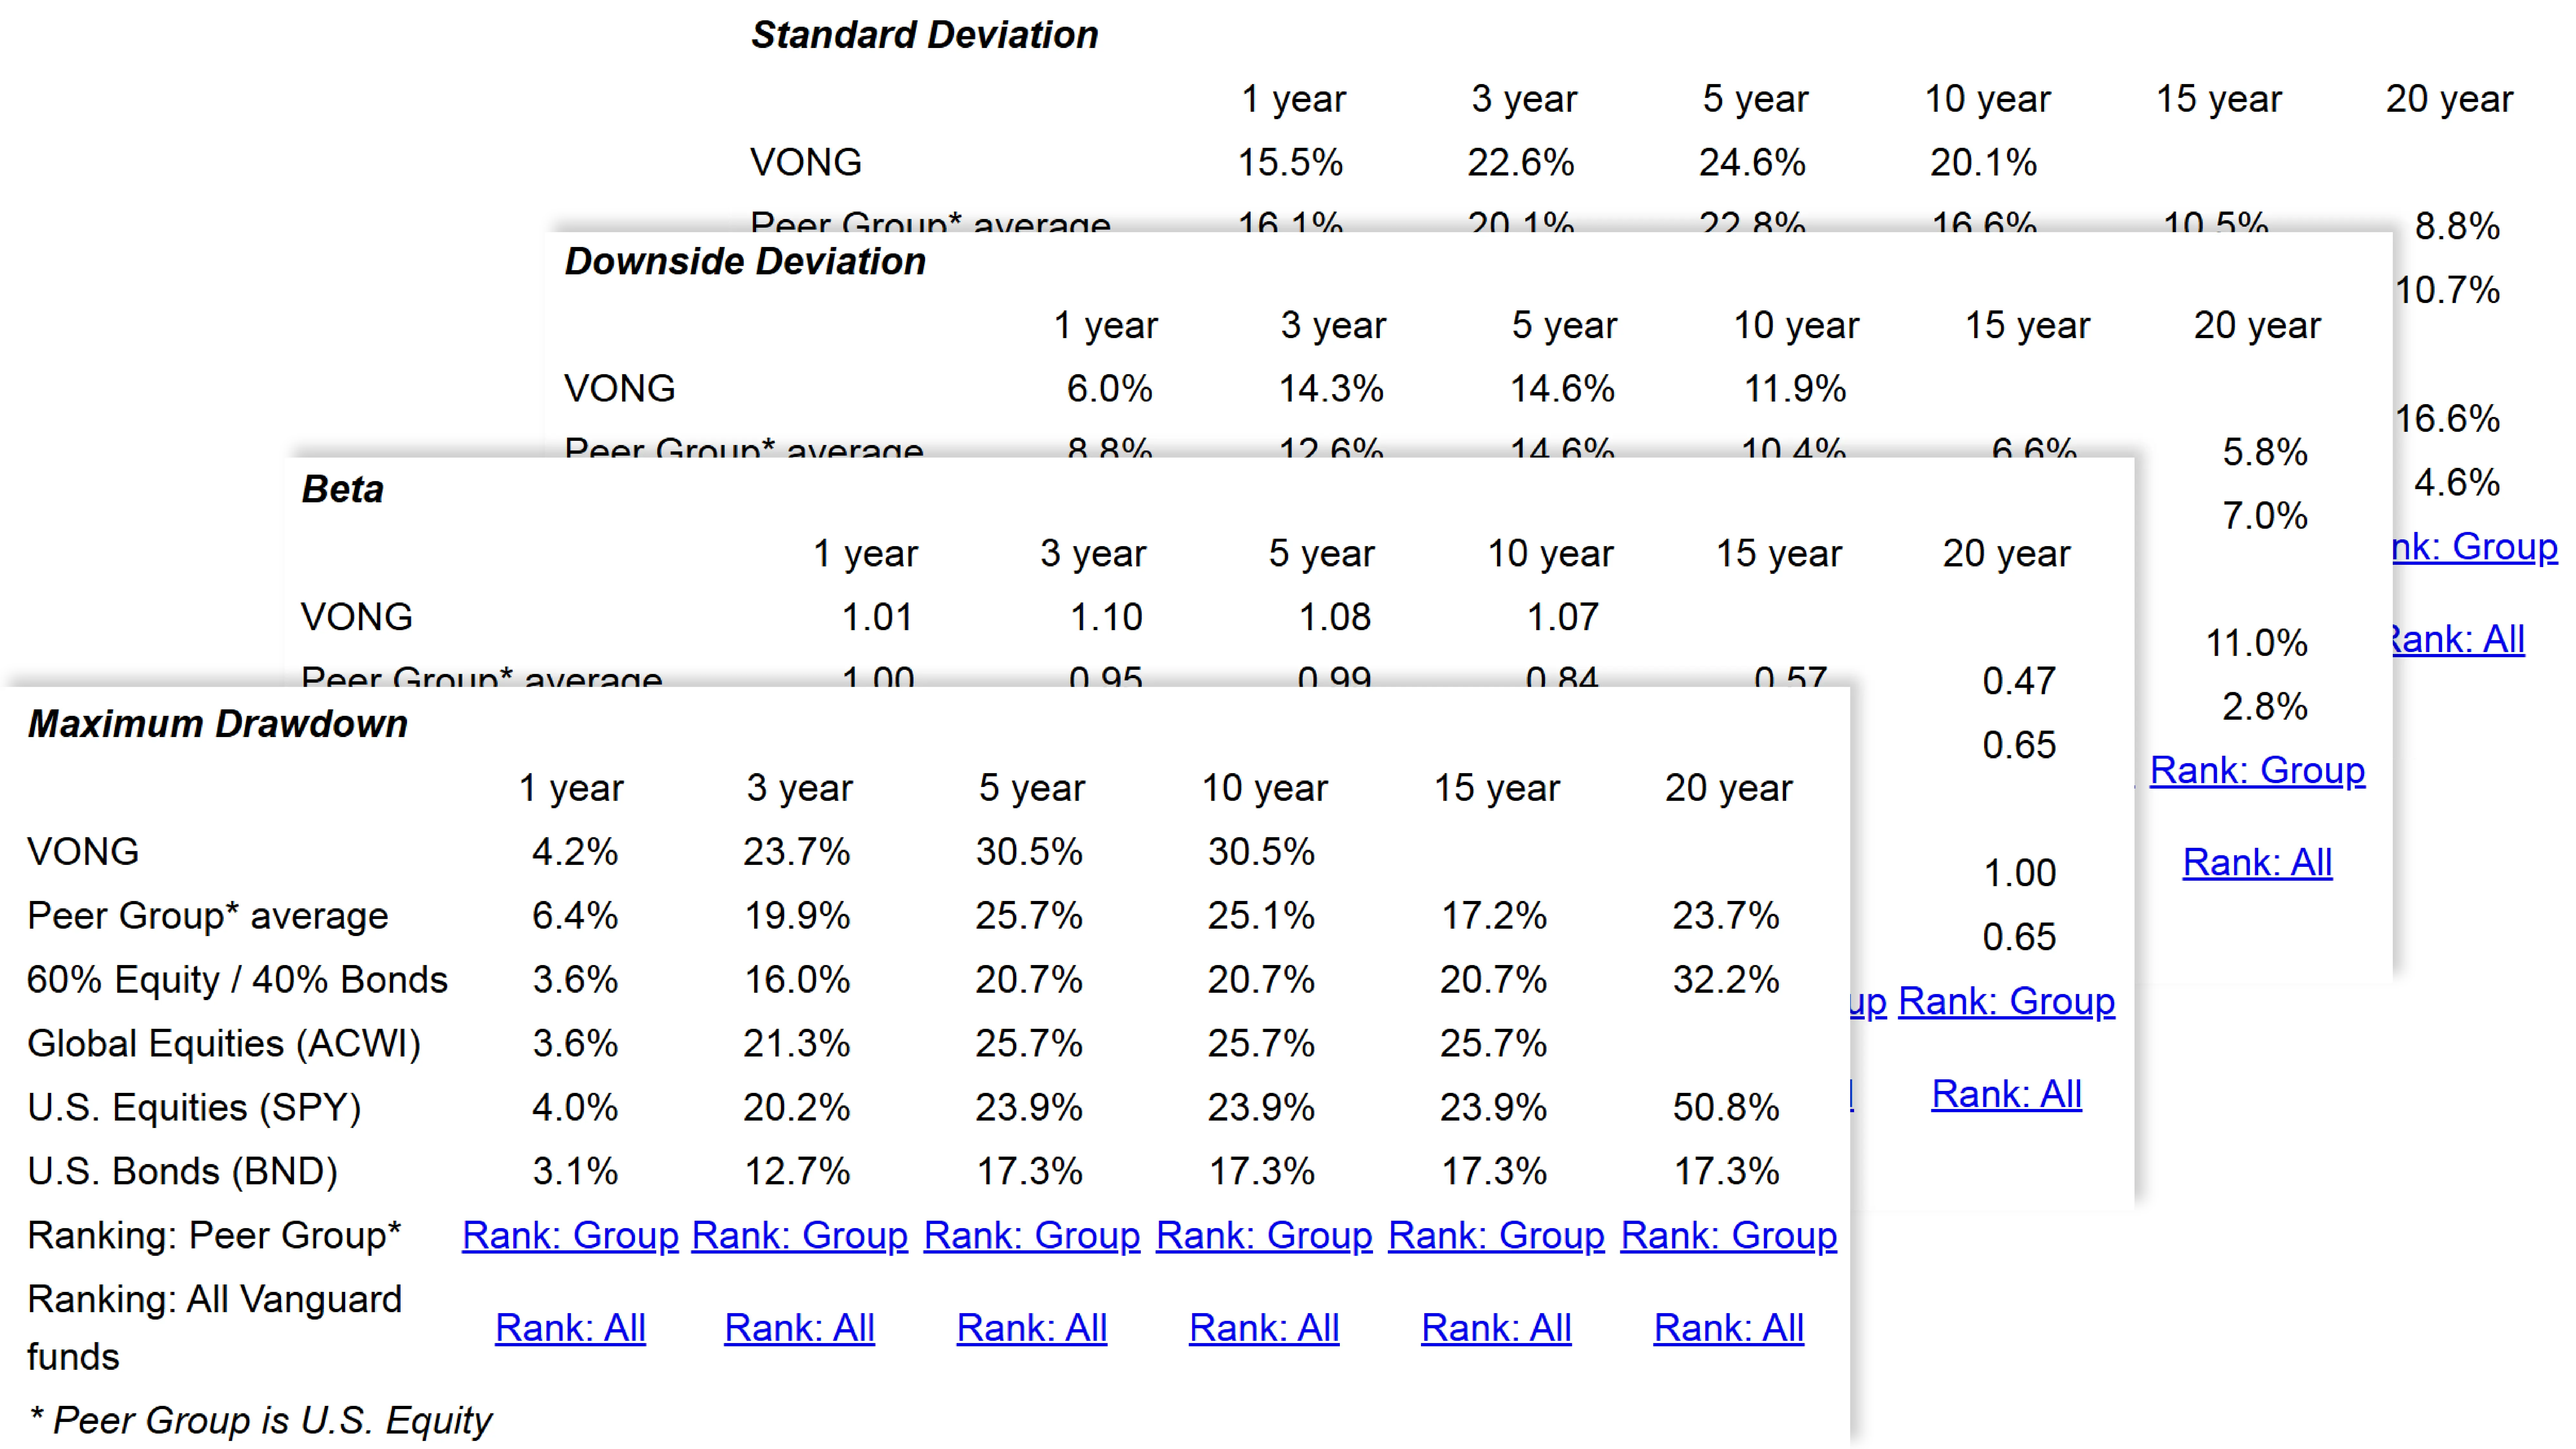
Risk and Volatility
Analyzes key risk metrics—maximum drawdown, downside deviation, standard deviation, and beta—to provide a comprehensive view of volatility and downside risk.
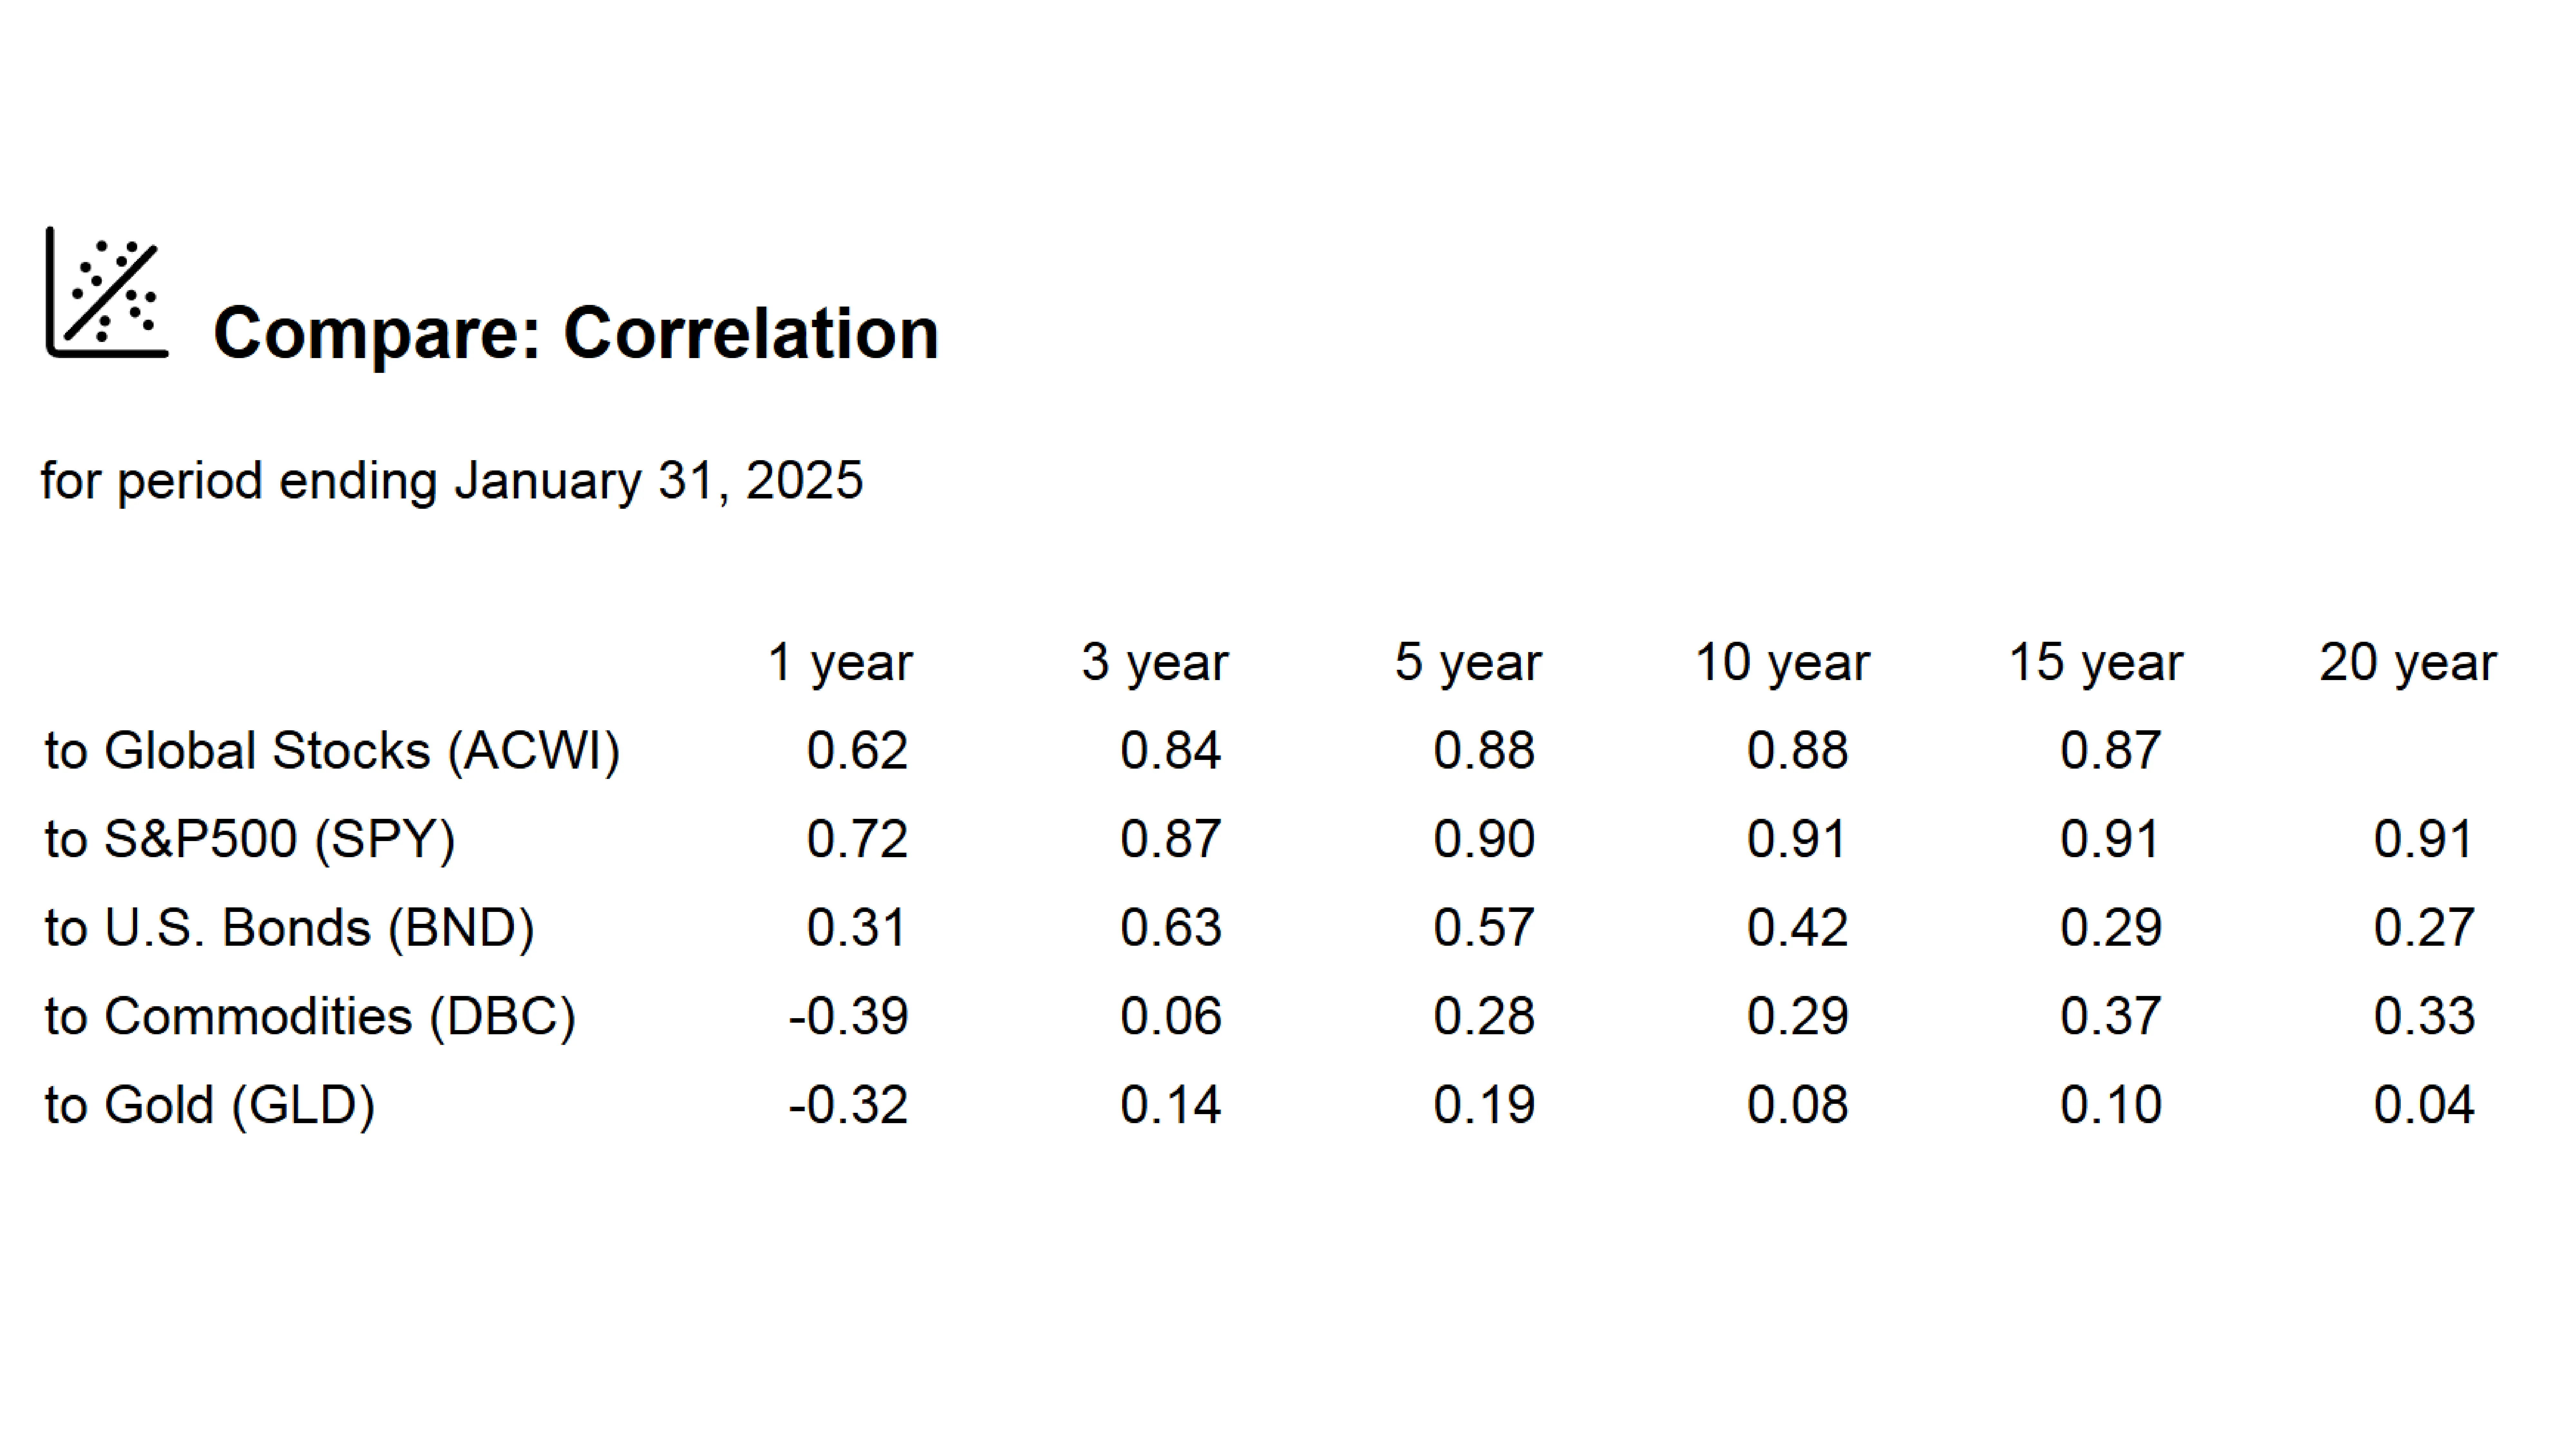
Correlation
Measures correlation with major asset classes, including global stocks, S&P 500, U.S. bonds, commodities, and gold, to assess diversification benefits and portfolio stability.

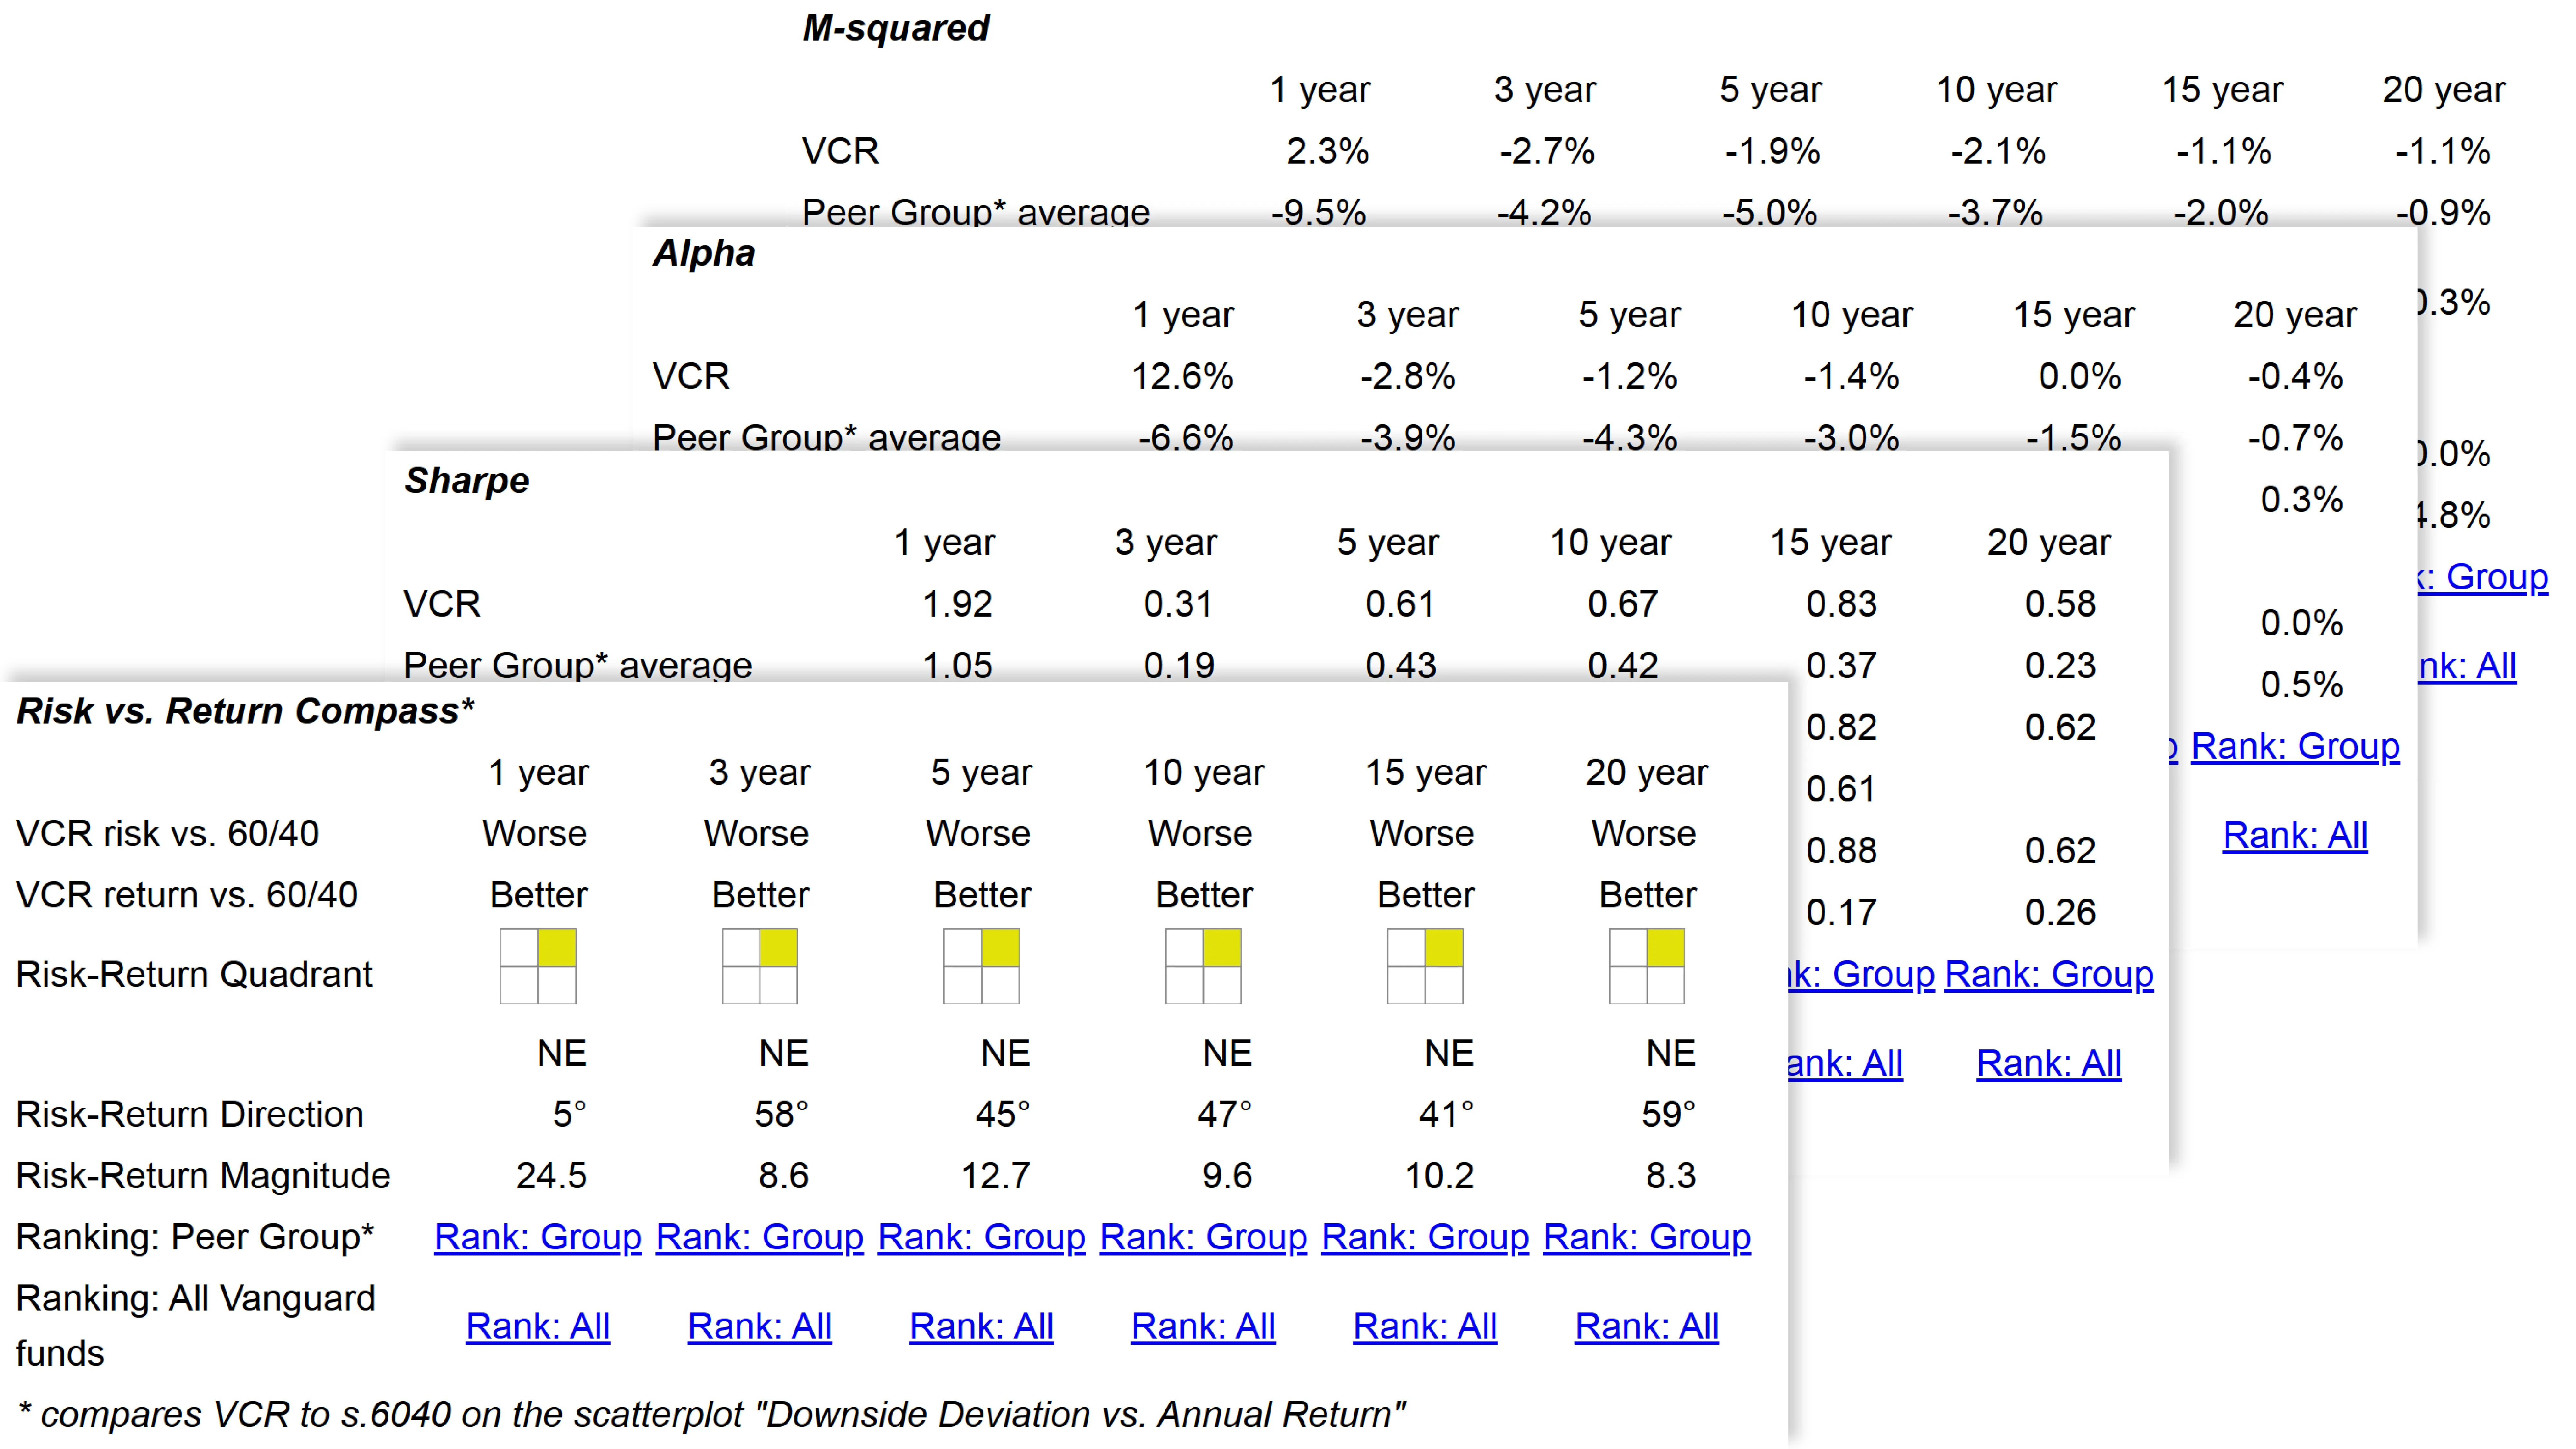
Risk vs. Return Metrics
Evaluates risk-adjusted performance using key metrics such as Alpha, M-Squared, Sharpe, Sortino, and Treynor ratios, along with a Risk vs. Return Compass for a comprehensive assessment.

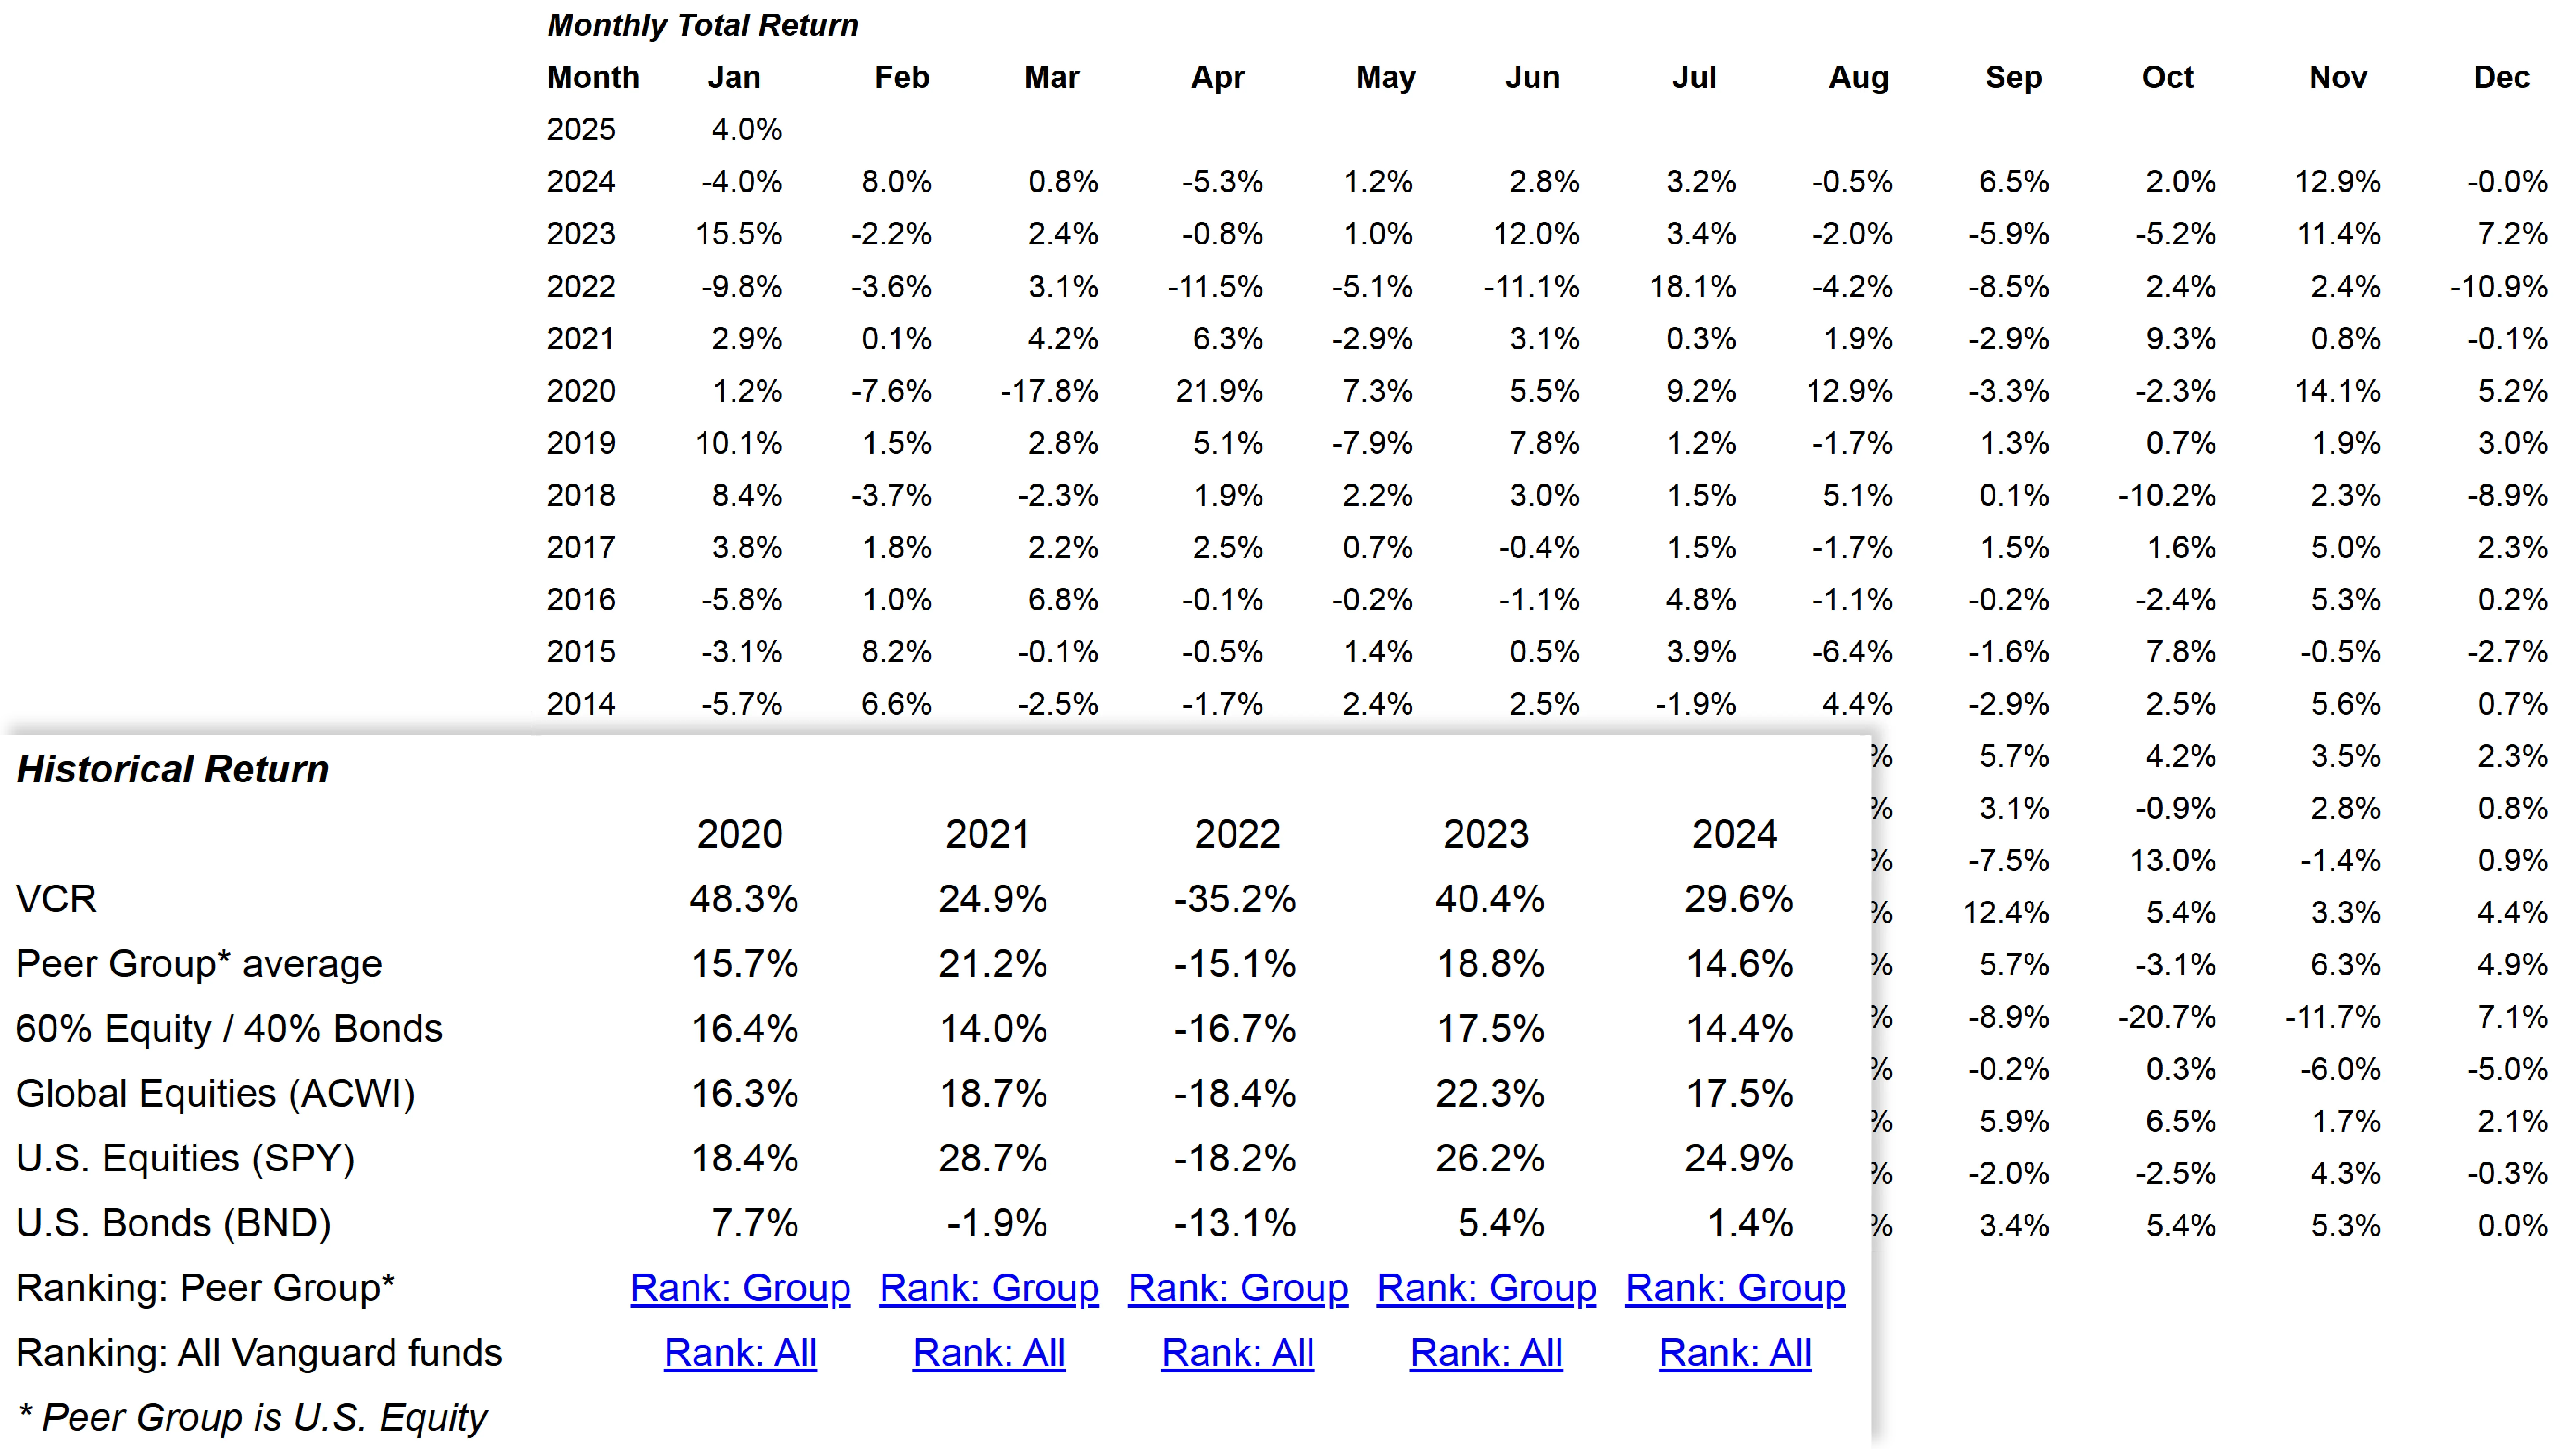
History
Displays monthly return data for the past 20 years (or since fund inception), offering insights into historical performance trends and market resilience.